UCLA Presents voteview.com beta 3
Polarization in Congress
Jeff Lewis
July 02, 2026
Here we create the polarization data and key graphics the Keith shows
and describes in greater detail here.
You can download the Rmarkdown code that produces this file
and all of the data sets and graphics presented here.
This polarization data set includes the following fields (again following Keith):
0. Chamber
1. Congress Number
2. First Year of the Congress
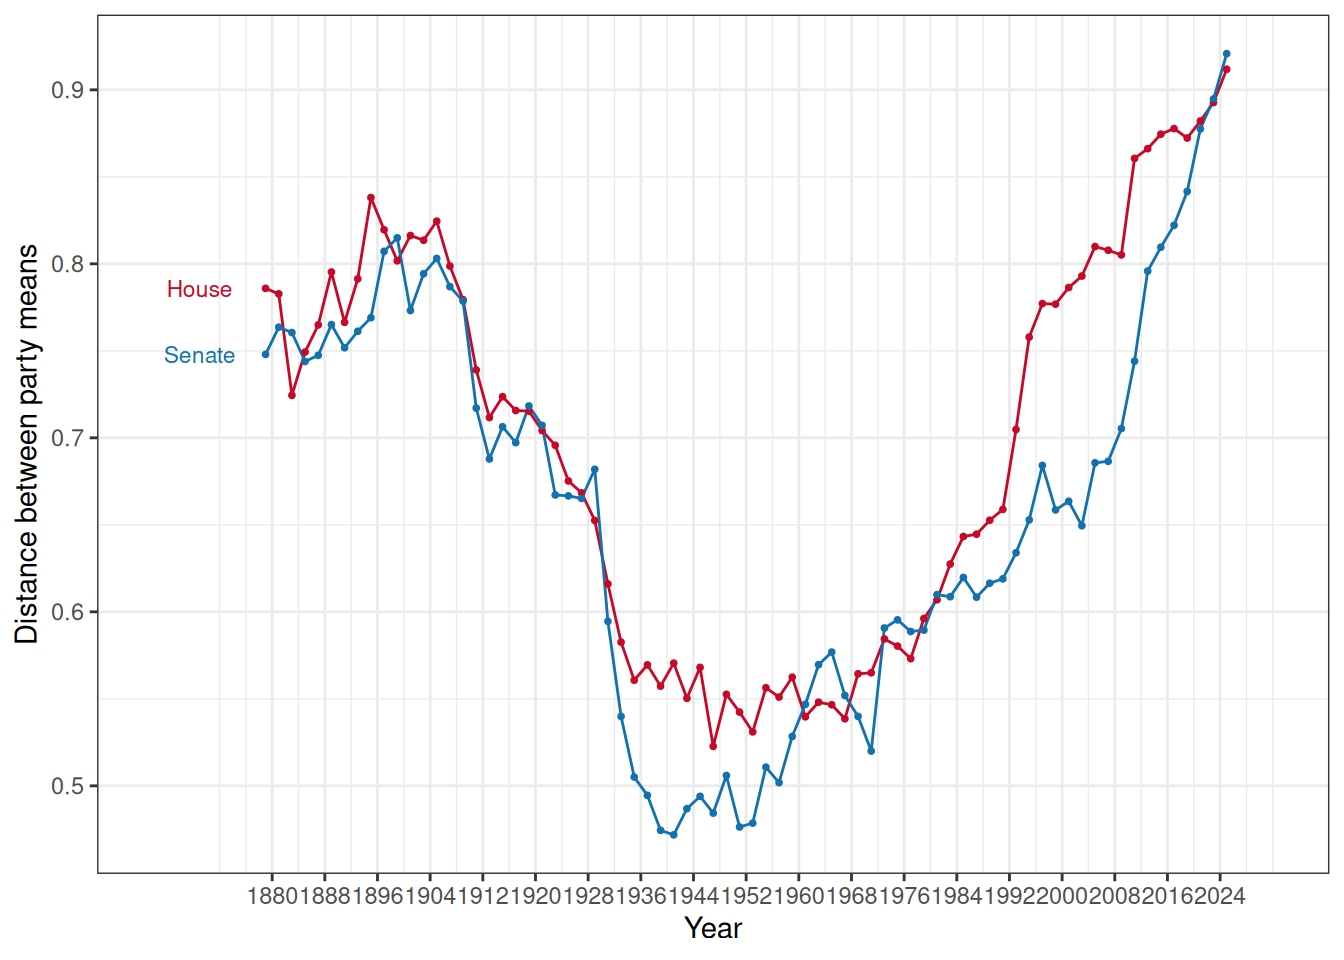
3. Difference in Party Means - first dimension
4. Proportion Moderates
5. Proportion of moderate Democrats (-0.25 to +0.25)
6. Proportion of moderate Republicans (-0.25 to +0.25)
7. Overlap
8. Chamber Mean - first dimension
9. Chamber Mean - second dimension
10. Democratic Party Mean - first dimension
11. Democratic Party Mean - second dimension
12. Republican Party Mean - first dimension
13. Republican Party Mean - second dimension
14. Northern Republican Mean - first dimension
15. Northern Republican Mean - second dimension
16. Southern Republican Mean - first dimension
17. Southern Republican Mean - second dimension
18. Northern Democrat Mean - first dimension
19. Northern Democrat Mean - second dimension
20. Southern Democrat Mean - first dimension
21. Southern Democrat Mean - second dimensionWe begin by loading the data current nominate data from Voteview.com:
To calculate the mean location of the Northern and Southern Democratic and Republican delegations, we follow Congressional Quarterly in defining the “Southern states” as the 11 states of the Confederacy plus Oklahoma and Kentucky. Note also the Democrats and Republicans are ICPSR party codes 100 and 200 respectively.
Here is the R code that transforms the member-year
NOMINATE data into the chamber-year data on polarization:
south <- c(40:49,51,53)
polar_dat <- nom_dat |>
    filter(congress>45 &
           chamber != "President") |>
    mutate(
      year = 2*(congress-1) + 1789,
    ) |>
    summarize(
      .by = c(chamber, congress, year),
      party.mean.diff.d1 = mean(nominate_dim1[party_code==200],na.rm=T) -
                           mean(nominate_dim1[party_code==100],na.rm=T),
      prop.moderate.d1 = mean(abs(nominate_dim1)<0.25,na.rm=T),
      prop.moderate.dem.d1 = mean(abs(nominate_dim1[party_code==100])<0.25,na.rm=T),
      prop.moderate.rep.d1 = mean(abs(nominate_dim1[party_code==200])<0.25,na.rm=T),
      overlap = (sum(nominate_dim1[party_code==200] <
                       max(nominate_dim1[party_code==100],na.rm=T),na.rm=T)  +
                 sum(nominate_dim1[party_code==100] >
                       min(nominate_dim1[party_code==200],na.rm=T),na.rm=T))/
                 (sum(!is.na(nominate_dim1[party_code==100]))+
                  sum(!is.na(nominate_dim1[party_code==200]))),
      chamber.mean.d1 = mean(nominate_dim1,na.rm=T),
      chamber.mean.d2 = mean(nominate_dim2,na.rm=T),
      dem.mean.d1 = mean(nominate_dim1[party_code==100],na.rm=T),
      dem.mean.d2 = mean(nominate_dim2[party_code==100],na.rm=T),
      rep.mean.d1 = mean(nominate_dim1[party_code==200],na.rm=T),
      rep.mean.d2 = mean(nominate_dim2[party_code==200],na.rm=T),
      north.rep.mean.d1 = mean(nominate_dim1[party_code==200 &
                                             !(state_icpsr %in% south)],na.rm=T),
      north.rep.mean.d2 = mean(nominate_dim2[party_code==200 &
                                             !(state_icpsr %in% south)],na.rm=T),
      south.rep.mean.d1 = mean(nominate_dim1[party_code==200 &
                                              (state_icpsr %in% south)],na.rm=T),
      south.rep.mean.d2 = mean(nominate_dim2[party_code==200 &
                                             (state_icpsr %in% south)],na.rm=T),
      north.dem.mean.d1 = mean(nominate_dim1[party_code==100 &
                                              !(state_icpsr %in% south)],na.rm=T),
      north.dem.mean.d2 = mean(nominate_dim2[party_code==100 &
                                              !(state_icpsr %in% south)],na.rm=T),
      south.dem.mean.d1 = mean(nominate_dim1[party_code==100 &
                                              (state_icpsr %in% south)],na.rm=T),
      south.dem.mean.d2 = mean(nominate_dim2[party_code==100 &
                                              (state_icpsr %in% south)],na.rm=T),
    )
Here are the first few lines of the resulting dataset:
## # A tibble: 6 × 22
##   chamber congress  year party.mean.diff.d1 prop.moderate.d1
##   <chr>      <dbl> <dbl>              <dbl>            <dbl>
## 1 House         46  1879              0.786            0.130
## 2 Senate        46  1879              0.748            0.160
## 3 House         47  1881              0.783            0.100
## 4 Senate        47  1881              0.764            0.141
## 5 House         48  1883              0.724            0.216
## 6 Senate        48  1883              0.760            0.141
## # ℹ 17 more variables: prop.moderate.dem.d1 <dbl>, prop.moderate.rep.d1 <dbl>,
## #   overlap <dbl>, chamber.mean.d1 <dbl>, chamber.mean.d2 <dbl>,
## #   dem.mean.d1 <dbl>, dem.mean.d2 <dbl>, rep.mean.d1 <dbl>, rep.mean.d2 <dbl>,
## #   north.rep.mean.d1 <dbl>, north.rep.mean.d2 <dbl>, south.rep.mean.d1 <dbl>,
## #   south.rep.mean.d2 <dbl>, north.dem.mean.d1 <dbl>, north.dem.mean.d2 <dbl>,
## # south.dem.mean.d1 <dbl>, south.dem.mean.d2 <dbl>You can download this dataset as a csv here.
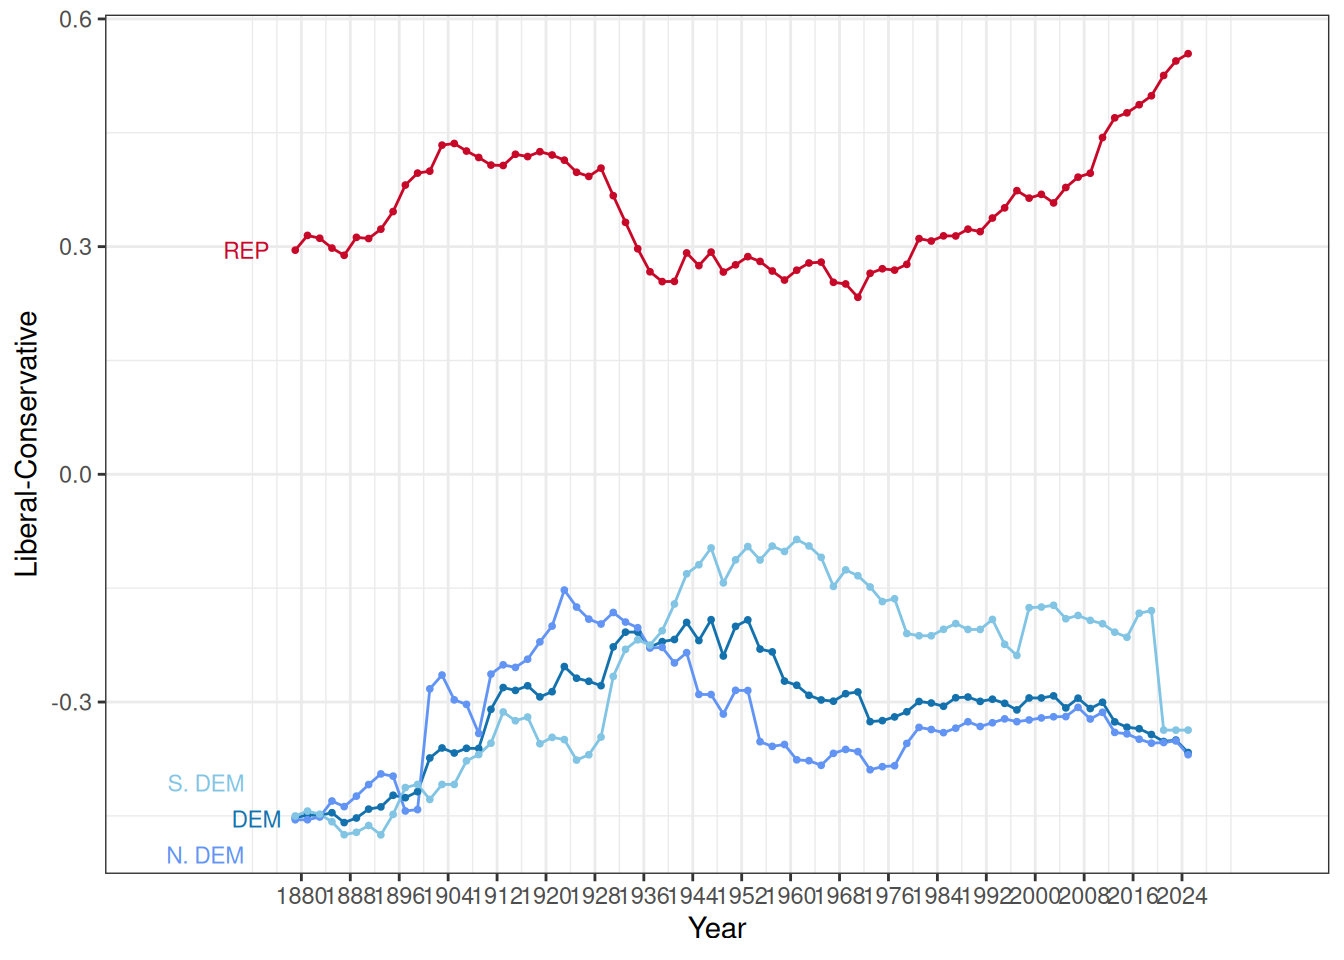
Party means on the liberal-conservative dimension over time by chamber
Here are up to date versions of the famous party means over time plots for each chamber:
